AFTER A LACKLUSTER SPRING MARKET, A MACRO SHIFT TOWARDS HOMEBUYERS EMERGES
Author:
Data Sources: You can track Twin Cities housing market trends here. You can track mortgage rates here. You can track home builder confidence here. You can track lumber prices here. You can track showing volume here.
Nationwide Summary: This past May, the housing market in the United States experienced its slowest May, since 2009 (during the heart of the financial crisis) as the 'higher for longer' interest rate regime continues to put downward pressure on housing affordability and mobility. One viewpoint is that we have burned through much of the liquidity that was pumped into the system as a monetary response to COVID, and now that we are on the backside of that phenomenon, in a tighter monetary environment, affordability is becoming more of an issue as many of today's buyers are finding difficulty in paying the combination of today's elevated prices and today's elevated interest rates. Additionally, and especially at the top end of the market, economic uncertainty, tariff uncertainty, and Geo-political uncertainty have all played roles in causing some pause with respect to residential buy/sell decisions. Markets like SW Florida, where a higher percentage of the housing inventory is used for speculative investment, second homes, and/or vacation rentals are the markets that are currently most tilted towards buyers.
Twin Cities Summary: Due to the relatively strong job market in Minnesota and the fact that most of the homes in this market are used as residences rather than short term vacation rentals or second homes, the housing market locally has out-performed the broader U.S. housing market.
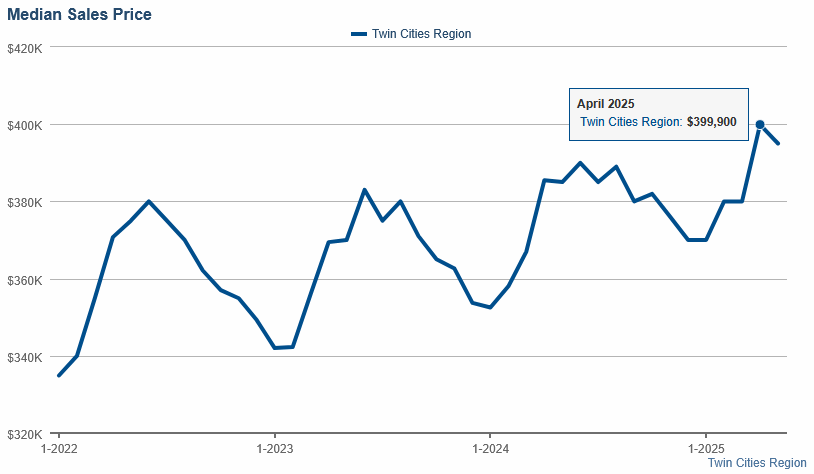
The Median Home Price: The median home price in the Twin Cities (for homes, condos, and townhouses combined) set a new record high in the month of April at $399,900, but then fell in the month of May, to $395,000. Aside from the COVID pause of 2020, I went back 50 years and could not find another month of May where prices for closed sales in the Twin Cities did not go up, let alone went down, so this has been a very abnormal spring.
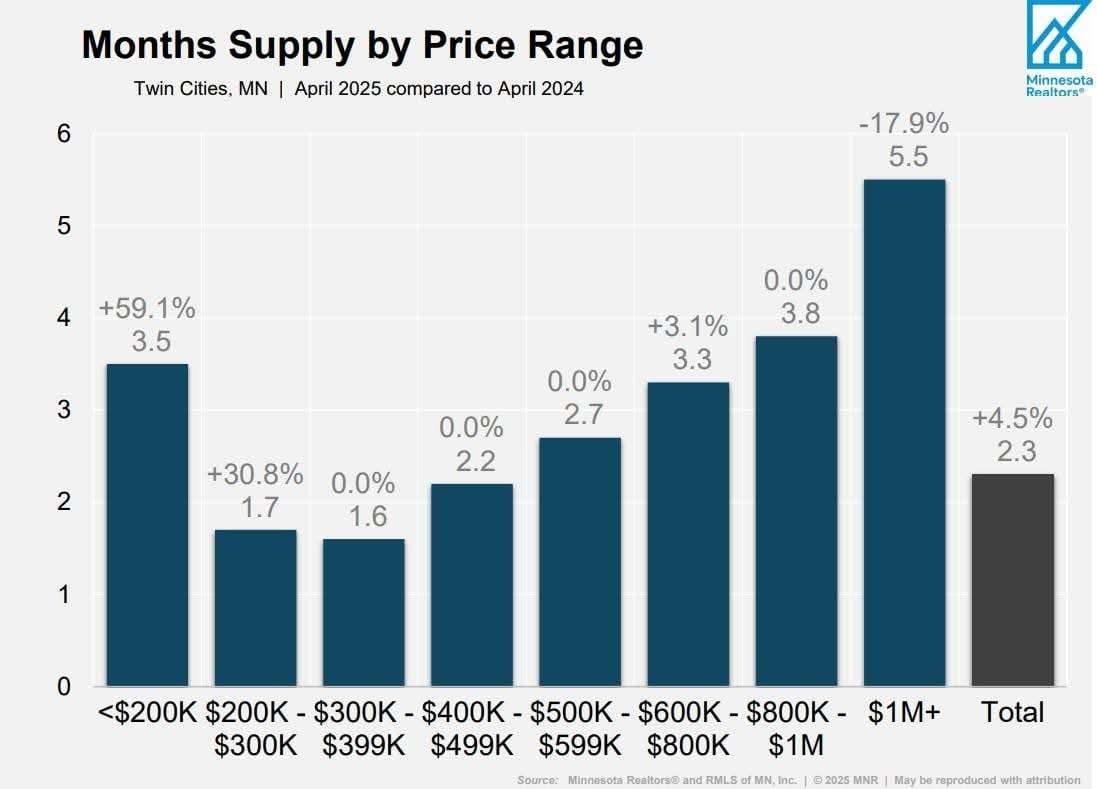
Absorption Rate: The recent slow down in housing gets more progressive as you move up in price range as evidenced by a review of the months supply of inventory broken down by price range (see below) which suggests a bottleneck as we enter the move-up price brackets. For single family homes, the luxury market segments (homes priced at $1 MM+) are currently in a buyer's market with 5.5 months worth of inventory. The $800K - $1 MM segment remains in a neutral market, while the segments under $800K, remain in a mild seller's market. Bare in mind that these are broad data points and that hyper local analyses are a more accurate way to assess the market relative to a specific property. The idea is that the top end of the value range for any area tends to be softer right now while the bottom end tends to be more firm, with a sliding spectrum in between. One primary catalyst for this is that the vast majority if not all of the single family home inventory that is being built and that has been built over the past 12 years, has been in the upper bracket price segments, as those have been the only segments offering builders a viable profit margin. Stated differently, homebuyers in the lower brackets only have one option, to buy an older existing home and so those markets are more firm, while homebuyers in the upper brackets have existing homes and new build options. I believe the record for the median home price set in April of this year largely reflects inflation from the lower-end while the higher-end segments are plateauing and in some cases beginning to deflate.
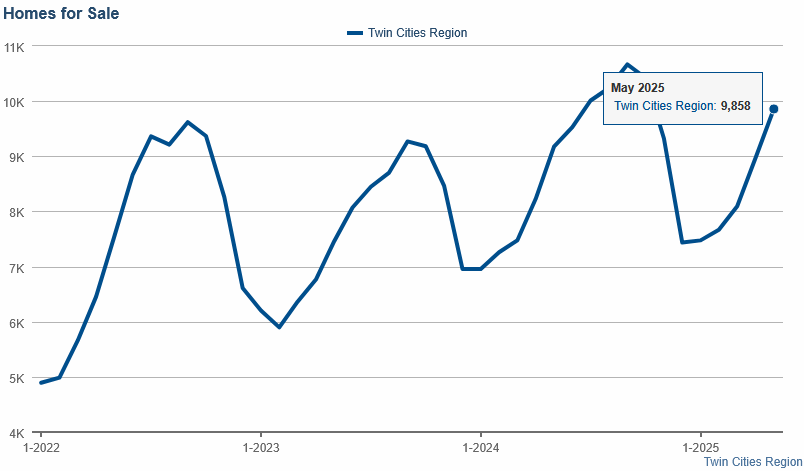
Home Inventory: The housing inventory in the Twin Cities rose to almost 10,000 units in May which is up 5% YOY, the highest inventory level we have had in May, since May of 2020, at the onset of the pandemic, right before the extreme seller's market set in. The inventory remains low on a historical basis but is on track to move back to pre-pandemic levels by fall under the current rate of change, while demand is down 30% from where it was at this time in 2019.
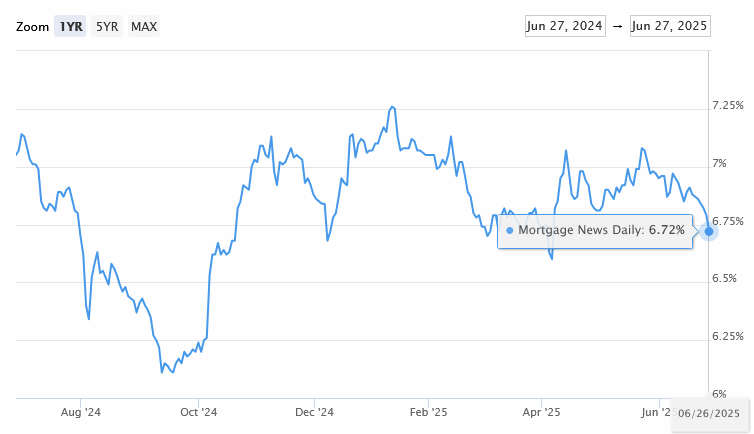
Mortgage Rates: I believe that the most likely scenario is that long-term rates peaked for the spring/summer market (and maybe even for the year) back on May 22nd, at above 7% for a 30-year-fixed mortgage. Our advisors at Hedgeye Risk Management made the call two weeks ago for a shift from a Quad 2 economic environment (where growth data and inflation data accelerate and long-term rates tend to rise) to a hybrid of Quad 4/Quad 3 (where growth slows and long-term rates tend to fall) in Q3 (July - September). I believe the bond market began to price in that shift back in June as mortgage rates have been steadily falling, a trend that will likely continue on net, at least through early September.
Falling rates tend to help bring buyers back into the market in three ways, 1) by reducing the cost of capital/increasing affordability, 2) by creating a more sustainable rate for long-term moves, and 3) by eliminating the pauses that can be created by an upward, volatile trend in rates.
Offer Terms: As the market has shifted, its not just prices at the top end that have been softening, its also terms that have been softening. Inspection contingencies are back to common, often even in bidding war scenarios. Softer terms that have been very uncommon over the past 12 years, like offers with contingencies for the sale of another property, especially in move up brackets, have been re-emerging as a factor.
High-Level Perspective: If I was to synthesize at a high-level my view of the Twin Cities housing market over the past 5 years, I would say that 2020-2022 was an extreme, liquidity fueled, seller's market with the strongest premiums attached to scarce, high-value locations/settings (maybe the strongest on record), 2023 was slightly tilted towards sellers and then transitioned to neutral, 2024 was a neutral market, and 2025 has been slightly tilted towards buyers.
Summer Outlook: Despite the broad softening currently happening in the market, some segments still remain in a seller's market and home prices across all segments are still up significantly from pre-pandemic levels. Equity remains solid for most residential property owners. From a seasonal headwinds perspective, the summer market tends to be a cool off period where inventory continues to rise while demand subsides. While we can't ignore those headwinds in our pricing strategies for sellers, we are also likely to have the macro economic tail wind of stabilized/falling mortgage rates, at least for the next 2 - 3 months. The wild card of the economic/Geo-political uncertainty is difficult to handicap. Some of that could resolve in the near future and help bring buyers back into the market, especially at the higher end, but some of it could also worsen. Given that the spring was weaker than expected, its possible that the summer will be stronger than expected. In my view, its also likely that this is all part of a broader shift in the housing market correlated with the long-term debt cycle. Probably a little of both will turn out to be true, or maybe this is all just a simulation. Ask me in October. ;)
Sources: NorthstarMLS, InfoSparks Data, Hedgeeye Risk Management, FreddieMac.com, Nasdaq.com, TradingEconomics.com, fred.stlouisfed.org, The National Association of Home Builders